It is the classic investor’s dilemma. You have cash sitting in your account—maybe a year-end bonus, an inheritance, or just savings you’ve diligently accumulated. You know you should invest it. But you open your brokerage app and see the S&P 500 or the Dow Jones sitting at a record-breaking number. The charts look like they have gone vertical.
A pit forms in your stomach. “Surely,” you tell yourself, “it can’t go higher. If I buy now, I’m the greater fool. I’ll wait for a pullback. Just a 5% dip, and then I’m in.”
This feeling is financial vertigo. It is entirely natural, deeply human, and—according to almost every scrap of historical data we have—completely wrong.
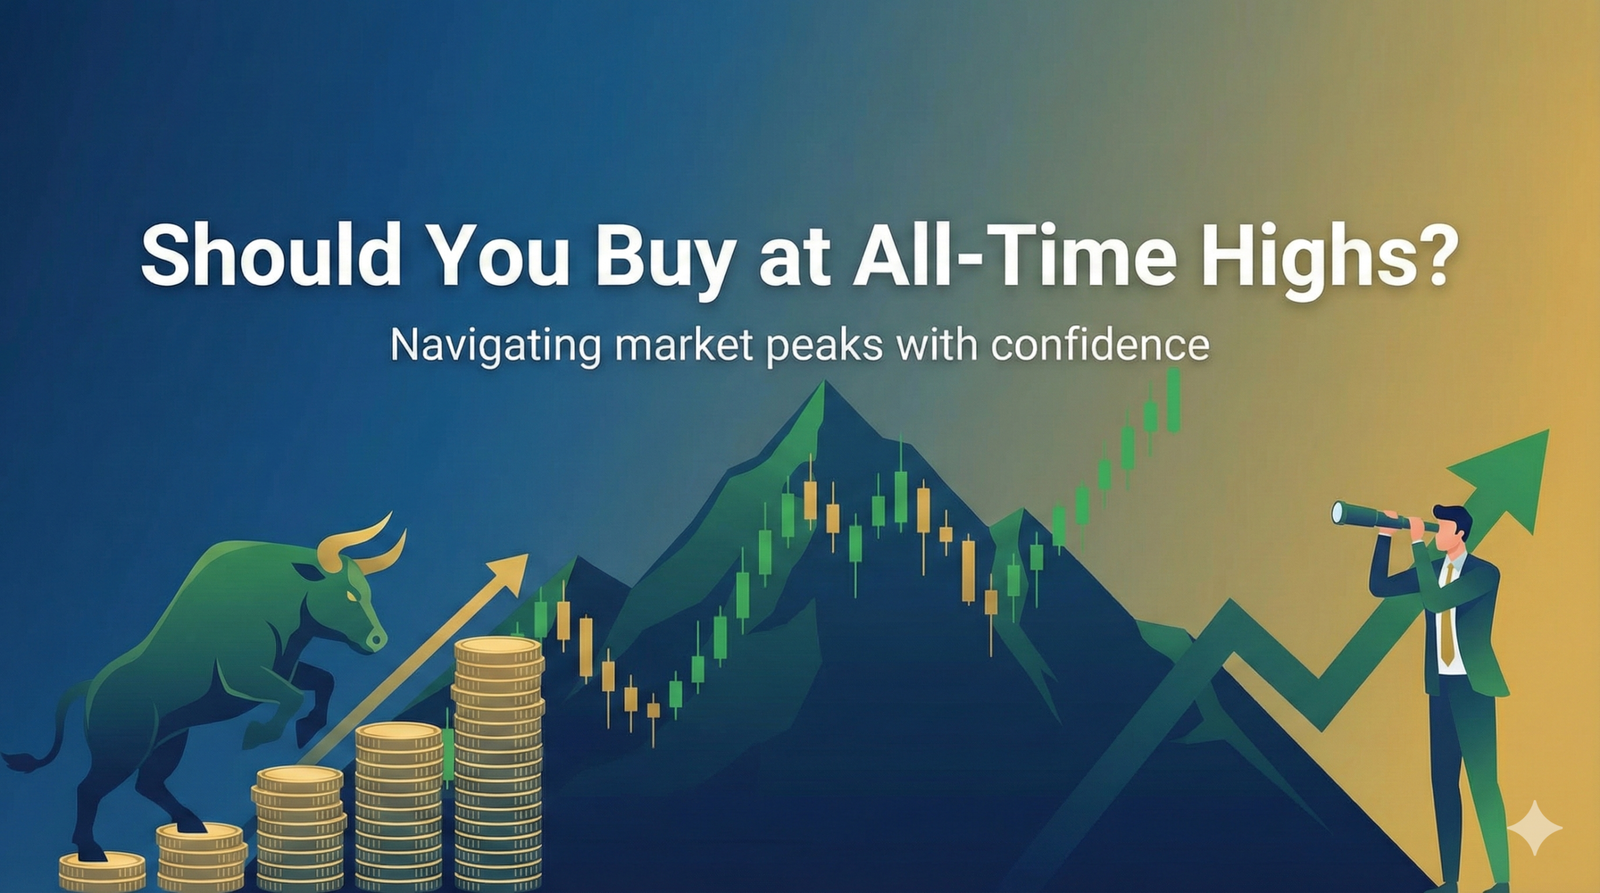
Buying at all-time highs is terrifying. It feels like buying a ticket for a roller coaster right before the drop. But history suggests that all-time highs are not the precipice of a crash; they are often the signaling of a new bull run.
In this deep dive, we are going to dismantle the fear of heights in the stock market. We will look at the hard math, the psychological traps, and the historical data from major financial institutions like J.P. Morgan and Charles Schwab that prove why waiting for the “perfect moment” is often the most expensive mistake an investor can make.
Part 1: The “All-Time High” Fallacy
Let’s start by reframing what an “All-Time High” (ATH) actually is.
In our daily lives, “high” prices are bad. If gas is at an all-time high, you drive less. If avocados are at an all-time high, you don’t make guacamole. We are conditioned as consumers to associate record high prices with “overpriced.”
But stocks are not avocados. They are income-generating assets. A stock price isn’t an arbitrary sticker; it reflects the aggregate earnings power of a company. As economies grow, companies earn more money. As they earn more money, their stock prices rise. Therefore, in a growing economy, the stock market should spend a significant amount of time at all-time highs.
If the market never hit all-time highs, it would mean the economy had stopped growing permanently.
The Data: Highs Happen in Clusters
One of the biggest misconceptions is that an all-time high is a rare, dangerous event—a “peak” before a valley.
According to data from RBC Wealth Management, since 1950, the S&P 500 has set over 1,200 all-time highs. That averages out to roughly 17 new record highs every single year.
Think about that. If you decided to “sit out” every time the market hit a record, you would be sitting out a massive portion of the market’s history.
Key Takeaway: Highs are not ceilings; they are often floors for the next leg up.
History shows that highs tend to cluster. When the market breaks a record, it signals strong momentum. It means investor sentiment is positive, earnings are strong, and the economy is humming.
- The “Crash” Myth: We tend to remember the highs that preceded crashes (like 1929 or 2000).
- The Reality: We conveniently forget the hundreds of highs that were followed by… more highs.
Part 2: What Happens After You Buy at a Peak?
This is the million-dollar question. If you put $10,000 into the market on the day it hits a record peak, are you doomed to underperform?
J.P. Morgan Asset Management and Schroders have both crunched the numbers on this, and the results are counter-intuitive.
A study by Schroders analyzed data going back to 1926. They compared two scenarios:
- Buying when the market is at an all-time high.
- Buying on any random day.
The results?
- Average annual return buying on a random day: ~10-11%
- Average annual return buying at an all-time high: ~10-11%
The difference is statistically negligible. In fact, over certain timeframes (like 12 months post-investment), buying at an all-time high actually produced slightly better returns on average because of the “momentum effect.” Trends tend to persist. When the market is strong enough to break a record, it usually has the strength to keep going.
The 1, 3, and 5-Year Outlook
According to RBC Global Asset Management, if you look at forward returns after a market peak:
- 1 Year Later: The market is higher roughly 70-80% of the time.
- 5 Years Later: The market has historically been higher 100% of the time (in most 20-year rolling periods).
There is virtually no statistical evidence that buying at a high reduces your long-term expected returns compared to buying on any other day.
Part 3: The High Cost of Waiting (The “Cash Drag”)
Now, let’s look at the alternative. You decide to wait. You sit in cash (or a high-yield savings account) waiting for a 10% correction so you can “buy the dip.”
This strategy seems prudent, but it suffers from a fatal flaw known as Cash Drag.
While you are waiting for the market to drop 10%, it might rise 20%.
- Scenario A: The market is at 100. You wait. It climbs to 120. Then it drops 10% to 108. You feel like a genius because you bought the dip! But you bought at 108. If you had just bought at 100, you would have been better off.
- Scenario B: The market never drops. It goes from 100 to 110, then 115, then 130. You are still sitting on the sidelines, paralyzed, waiting for a price that never returns.
The “Peter Perfect” vs. “Ashley Action” Study
This is perhaps the most famous study on the subject, conducted regularly by the Charles Schwab Center for Financial Research.
They created a hypothetical scenario involving five investors who received $2,000 in cash every year for 20 years.
- Peter Perfect: Had magical powers. He invested his $2,000 at the absolute lowest closing price of every year.
- Ashley Action: Invested her money immediately on the first trading day of the year, regardless of price.
- Matthew Monthly: Dollar-cost averaged (invested a small amount every month).
- Rosie Rotten: Had terrible luck. She invested her $2,000 at the absolute highest peak of every year.
- Larry Linger: Kept the money in cash (Treasury bills) waiting for a “better time” that never came.
The Results (over a 20-year period):
Obviously, Peter Perfect did the best. But here is the shocker:
- Ashley Action (Invest Immediately) came in second place, trailing Peter by only a small margin.
- Rosie Rotten (Invest at Peak) did surprisingly well. She earned significantly more than Larry Linger (Cash).
The Lesson: Even if you have the worst possible timing and buy at the peak every single year, you will still end up far wealthier than if you sit in cash trying to time the market. Being in the market matters infinitely more than when you get in.
You can read more about this study in Schwab’s article: Does Market Timing Work?
Part 4: Psychology—Why Our Brains Betray Us
If the math is so clear, why is it so hard to click “Buy”?
It comes down to Loss Aversion. Psychologists Daniel Kahneman and Amos Tversky discovered that the pain of losing money is psychological twice as powerful as the joy of gaining money.
- If you buy at an all-time high and the market drops 5% the next week, you feel stupid. You feel regret.
- If you sit in cash and the market goes up 5%, you feel “FOMO” (Fear Of Missing Out), but you don’t feel the same visceral pain of loss.
We are wired to avoid looking foolish. Buying at a peak feels like setting ourselves up to be the fool.
The “Just One More Dip” Trap
Many investors tell themselves, “I’m not trying to time the market, I’m just being cautious.”
This is a lie we tell ourselves. “Caution” in a bull market is often just disguised market timing.
Ask yourself: If the market drops 10% tomorrow, will you actually buy?
Usually, when the market drops 10%, the news is terrible. There is a war, a pandemic, or a recession fear. The headlines are screaming “SELL!” In that environment, most people who were “waiting for a dip” get too scared to buy. They then say, “I’ll wait until things stabilize.” By the time things stabilize, the market is back at all-time highs.
It is a vicious cycle of paralysis.
Part 5: Strategies for the Nervous Investor
Okay, you understand the math. You know you should invest. But you still can’t bring yourself to dump your entire life savings into the S&P 500 at a record high. That is fine. Personal finance is personal.
Here are three strategies to get invested without triggering a panic attack.
1. The Dollar Cost Averaging (DCA) Compromise
If you have a lump sum (say, $50,000), and you are terrified of putting it all in at the top, split it up.
- Invest $10,000 today.
- Invest $10,000 next month.
- Invest $10,000 the month after.
Why this works:
- Mathematically: Lump sum investing usually beats DCA (because markets go up more than they go down).
- Psychologically: DCA is superior for sleep. If the market drops after your first purchase, you are happy because your next $10,000 buys more shares at a discount. If the market goes up, you are happy because the money you already invested is growing. It is a psychological “win-win.”
2. Diversify Away from the Highs
Usually, when we talk about “All-Time Highs,” we are talking about the US Market (S&P 500). But the US is not the only market in the world.
- Are International Stocks at all-time highs?
- Are Small Cap Stocks at all-time highs?
- Are Bonds at all-time highs?
If the S&P 500 feels too expensive, you can rebalance. Perhaps you put new money into International Emerging Markets or US Value stocks, which might be trading at lower valuations than the big tech giants.
3. The “Regret Minimization” Framework
Imagine two futures 10 years from now.
- Future A: You bought at the high. The market crashed 20% right after, took 2 years to recover, and then grew normally. You are now up 80% total.
- Future B: You waited. The market went up 50% without you. You finally bought in. You are up 10% total.
Which regret is heavier? Most long-term investors realize that missing the train is more painful than a bumpy ride.
Part 6: When Should You Not Buy at All-Time Highs?
Is there ever a time to be cautious? Yes, but it has nothing to do with the chart looking “high.”
You should hesitate if:
- You need the money soon: If you need this cash for a down payment or tuition in less than 3-5 years, it should not be in the stock market at all, regardless of whether we are at a high or a low. Short-term volatility is real.
- Valuations are insane (The P/E Ratio Check): There is a difference between a “high price” and an “expensive valuation.”
- If the S&P 500 is at a high because earnings have doubled, that is healthy.
- If the S&P 500 is at a high because people are speculating on unprofitable companies (like the Dot-Com bubble), that is dangerous.
- Check: Look at the Forward P/E ratio of the market. Is it historically extreme (above 25x or 30x)? If so, lower your expected returns, but don’t necessarily exit entirely.
Conclusion: The Train is Leaving the Station
Imagine the stock market is a train that travels from New York to California. The train is almost always moving forward.
“All-Time Highs” just mean the train is further west than it has ever been before.
- Buying at a high means getting on the train in Chicago.
- Waiting for a dip means hoping the train reverses back to Ohio so you can hop on.
Sometimes the train does reverse. But usually, it just keeps chugging toward the Rockies. If you stand on the platform waiting for the train to back up, you might watch it disappear over the horizon.
The Verdict:
Don’t punish yourself for the market’s success. An all-time high is a sign of a healthy system. It is a signal that companies are innovating, consumers are spending, and wealth is being created.
If you have a long time horizon (10+ years), the price you pay today will likely look like a bargain in hindsight. As the old investing adage goes:
“The best time to plant a tree was 20 years ago. The second best time is today.”
Don’t let the fear of heights keep you grounded.
Authority References & Further Reading
- RBC Wealth Management: Investing at all-time highs
- J.P. Morgan: Guide to the Markets
- Of Dollars and Data: Should You Buy at an All-Time High?
Here is a video that dives deeper into the specific mechanics of investing during market peaks:
This video features financial advisors discussing the practical “how-to” of entering the market at peaks, reinforcing the data discussed above with real-world client examples.